AI Adoption Index Asset Optimization Cost of Delivery Optimization Distributed Process Management AI-enabled Employee Retention Index Hybrid Work Enablement Outsourcing Performance Management
Banking, Financial Services, and Insurance (BFSI) Business Process Outsourcing (BPO) Global Capability Center (GCC) Healthcare Revenue Cycle Management Information Technology (IT/ITeS)
Work Time Work Output Workflow Management Advanced Analytics Asset Optimization ProHanceCX

Improve RCM Throughput, Productivity, and Cost Efficiency

RCM leaders use ProHance to improve productive hours, reduce manual effort, stabilize daily output, and meet SLA targets
across Coding, AR, Billing, and Patient Access teams.
Dashboard
10-25%
FTE capacity realized
1 hr/day
productive time gained per user
15-30%
utilization improvement
10-25%
SLA performance improvement

Trusted by

GeBBS EPI Source Omega Healthcare Coronis Health Optum AGS Health Advantum Health GeBBS EPI Source Omega Healthcare Coronis Health Optum AGS Health Advantum Health

RCM Operations Need Predictability. ProHance Provides It.

Daily Productivity Loss

Teams lose productive time to idle hours, rework, and uneven workloads.

51% of staff spend 2+ hours on manual tasks daily

High Cost of Delivery

Labor-heavy functions depend on accurate capacity planning, not assumptions.

$18M avg annual loss on unused SaaS licenses

Output Variance

Performance differs widely across shifts, locations, and tenures.

>80% employees at burnout risk, impacting retention
Get a Daily Productivity Demo →

Operational
Clarity for Every
RCM Function

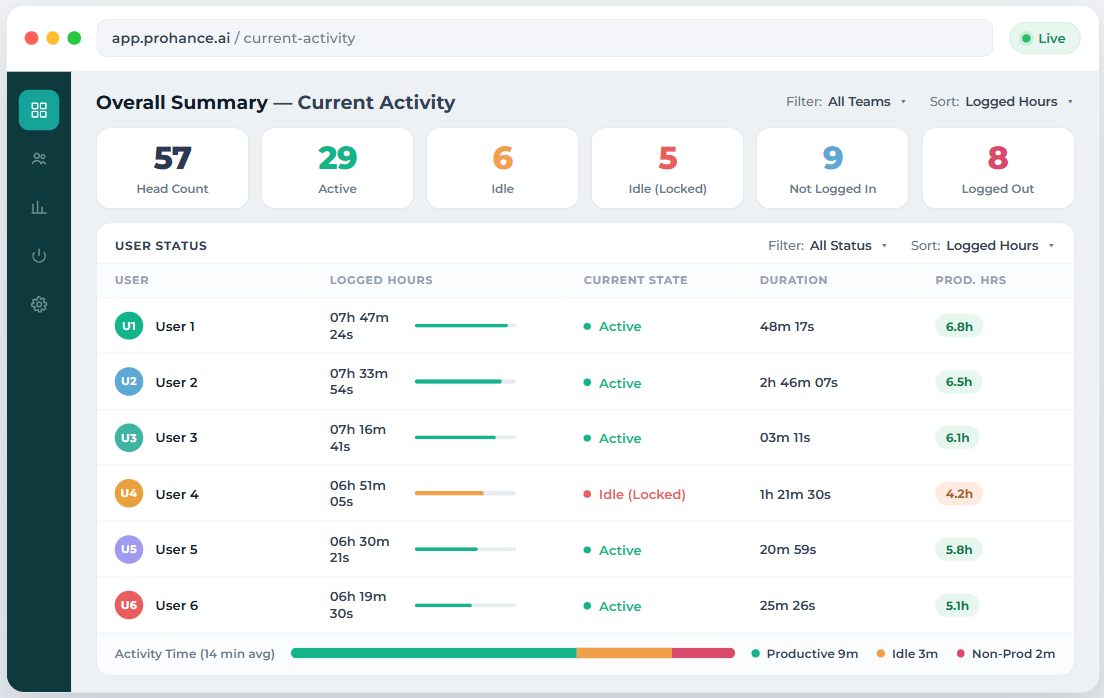
RCM Dashboard

Real-Time
Productivity Data

See productive, idle, and non-core activity across
teams.

Daily Variance
Correction

Address dips in output, adherence, or effort in
real time.

Performance
Comparison

Identify where output
falls behind expected
levels.

Workload
Alignment

Distribute tasks based on actual capacity and skill levels.

Built for the Full RCM Lifecycle

Five outcome-driven modules that give every layer of your RCM operation real-time clarity.
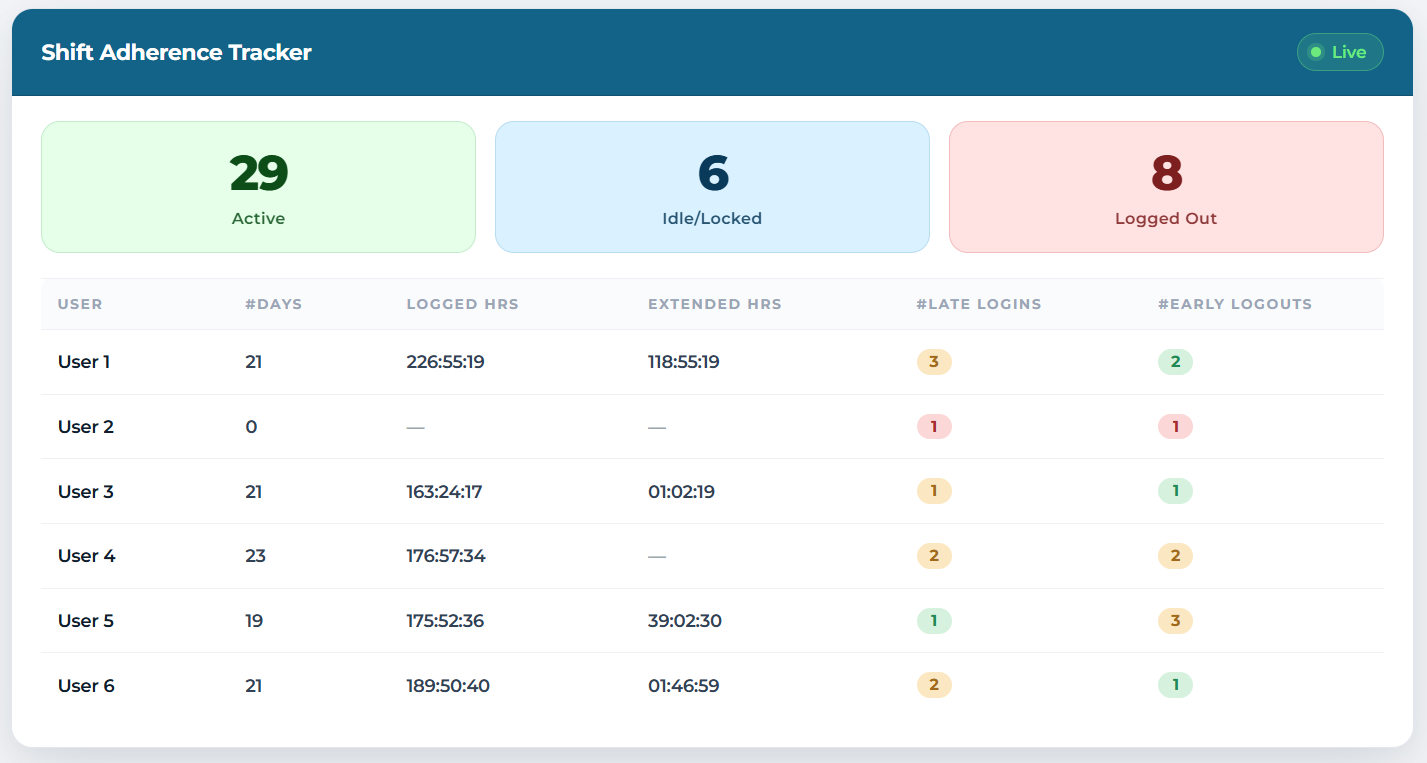
See How Every Minute Is Spent

  • 1 Track productive vs non-productive time
  • 2 Identify idle time and break patterns
  • 3 Identify available pockets of capacity in team
  • 4 Reduce 20–25% daily productivity leakage
+29 min/day improvement in avg productive time across all RCM deployments

Output & Performance Analytics

  • 1 Measure productivity by employee
  • 2 Compare team performance instantly
  • 3 Track KPI achievement trends
  • 4 Improve operational efficiency
+18% increase in overall team productivity

Skill & Will Insights

  • 1 Identify training opportunities
  • 2 Measure employee engagement
  • 3 Detect performance blockers
  • 4 Improve workforce effectiveness
+24% improvement in employee engagement

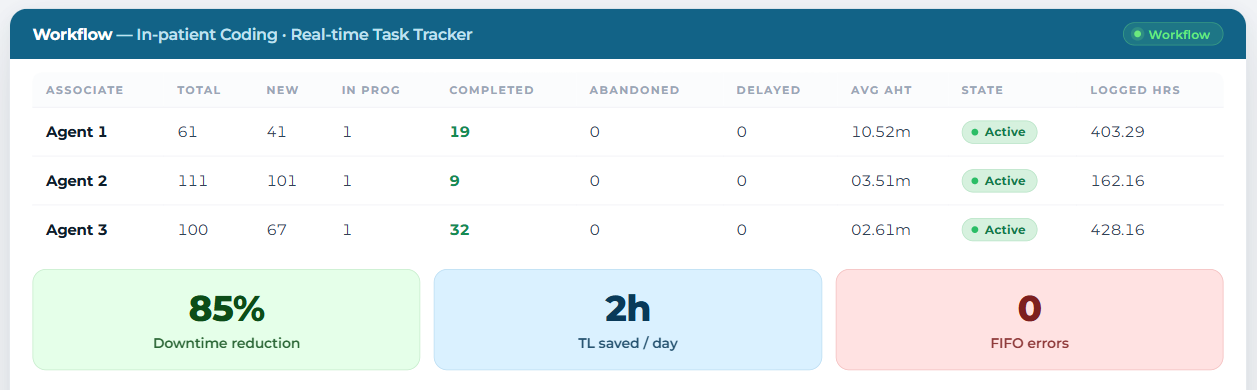
Workflow Control

  • 1 Monitor workflow bottlenecks
  • 2 Balance workload distribution
  • 3 Improve process visibility
  • 4 Increase delivery speed
+31% faster workflow completion rate

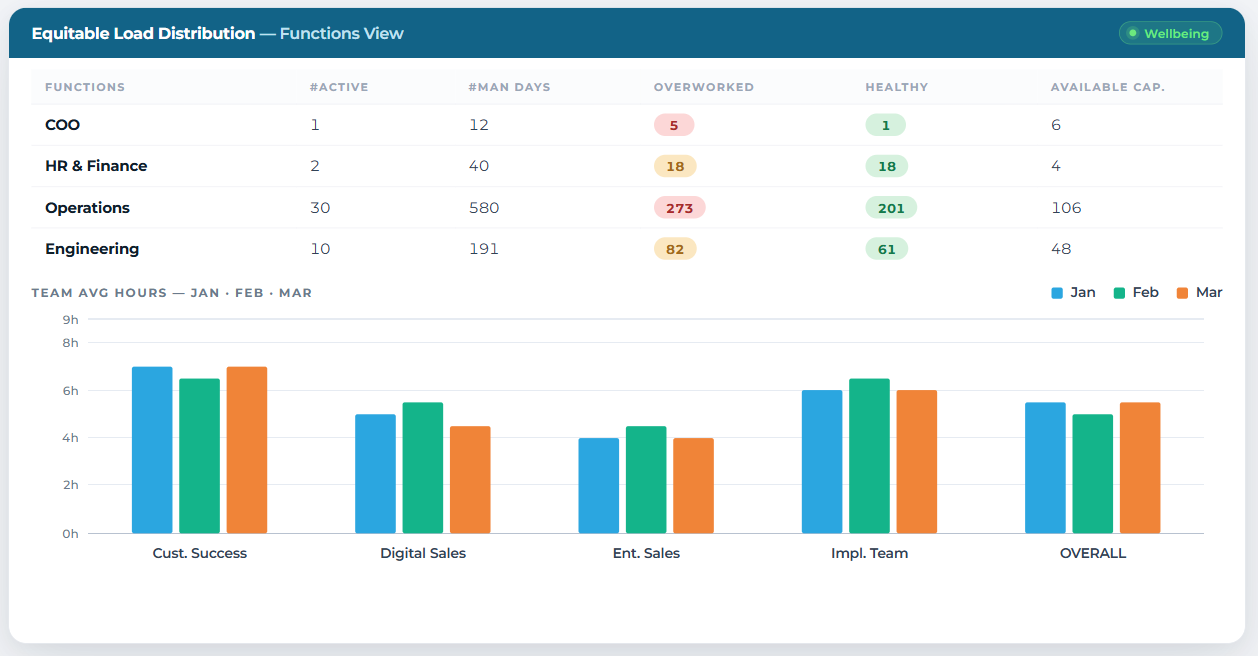
Wellbeing & Burnout

  • 1 Detect burnout indicators early
  • 2 Monitor workload pressure
  • 3 Improve work-life balance
  • 4 Enhance employee wellbeing
-22% reduction in burnout-related productivity loss

Identify Automation Opportunities Hiding in Plain Sight

ProHance maps time spent on core vs non-core activities, identifies idle time and non-value work, and pinpoints exactly which tools and files to automate first.

Use Case 1

Deploy Healthcare Tools

Replace email with EPIC for more efficient case management

10-15% more efficient
Use Case 2

Automate Repetitive Excel

File-level deep dive identifies top candidates for automation
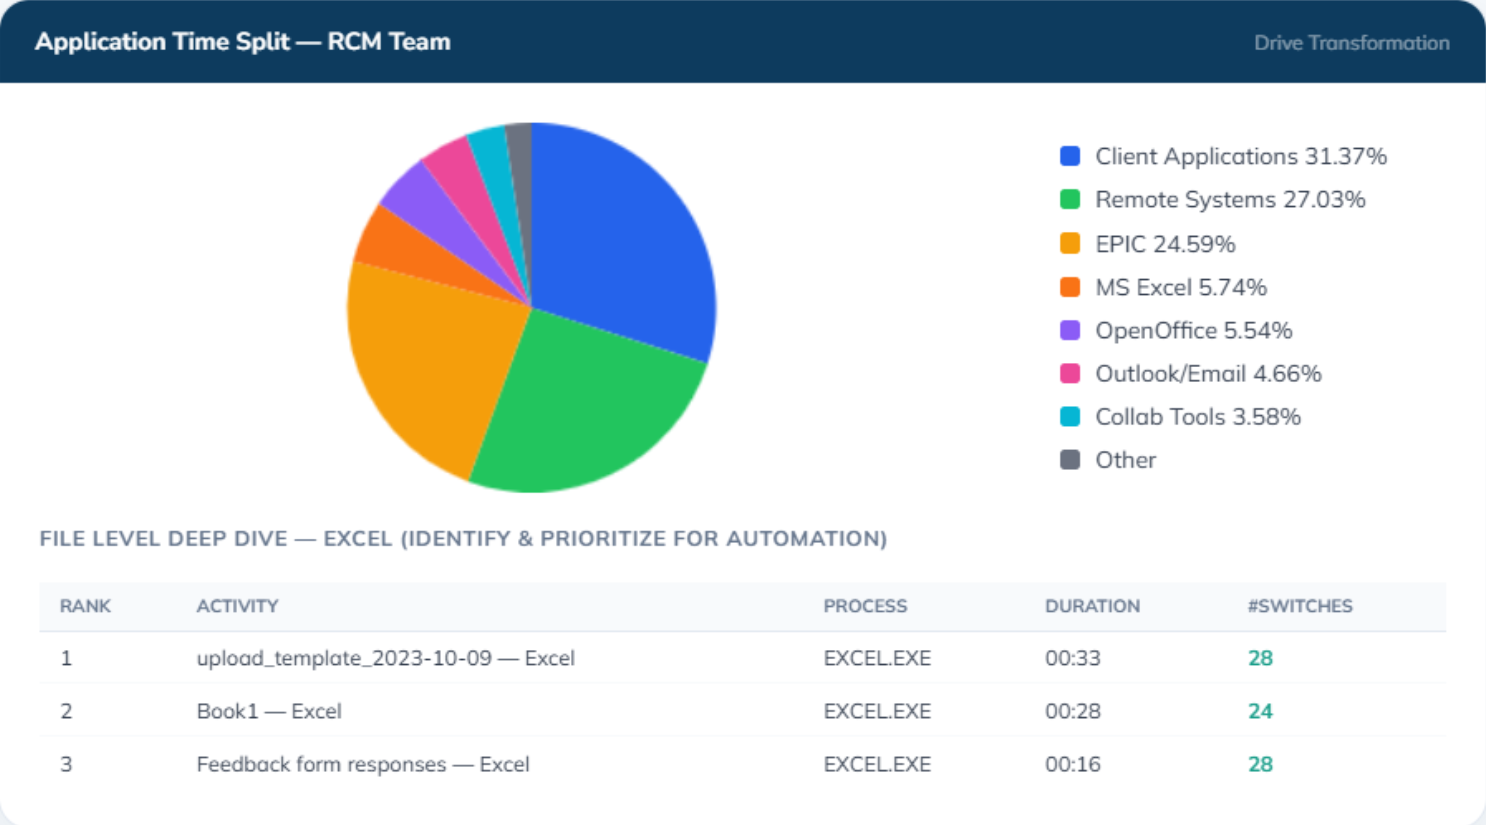
20–50% more efficient

Identify Top Performers. Coach Everyone Else Up.

ProHance's quadrant analysis maps every agent by productive time vs output achieved — surfacing exactly who needs training, who needs relief, and whose habits to replicate.
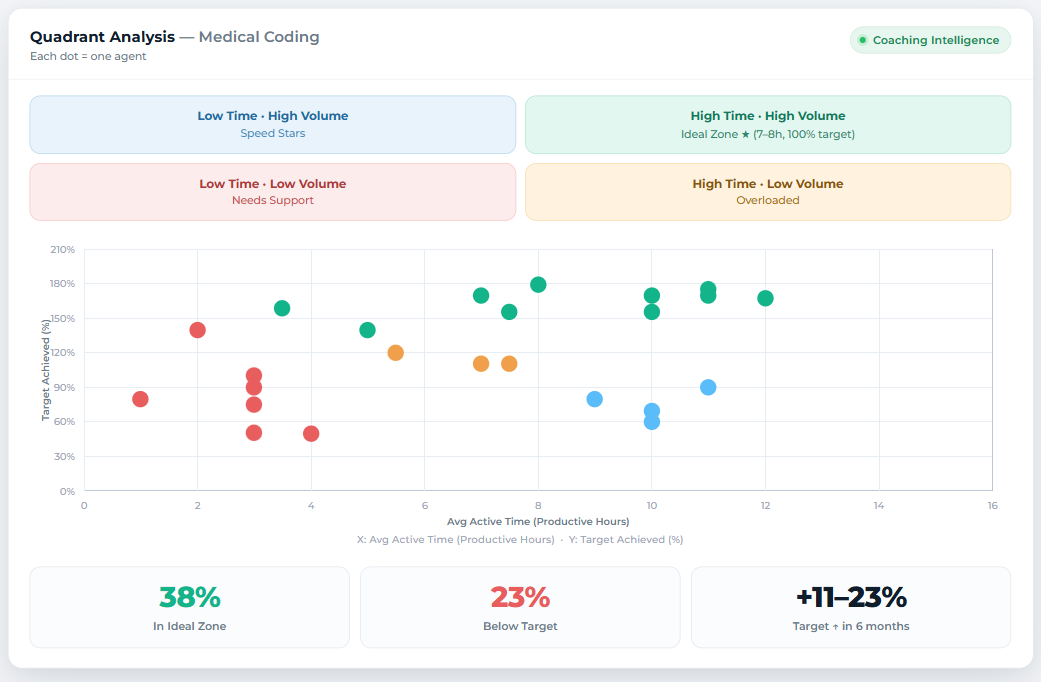
Quadrant Analysis
  • Ideal users: 7–8 hrs, 100% target achieved — ProHance shows exactly what they're doing right.
  • 23% of agents not hitting targets — training or coaching? ProHance gives you the evidence to decide.
  • Medical charts coded: 11–23% target increase over 6 months via quadrant-guided coaching.
  • Targets increased by 25% for Quadrant 3 users after data-backed coaching interventions.

How Leading RCM Teams Improved Performance

Operations leaders use ProHance to unlock capacity, stabilize daily output, and turn productivity into a measurable advantage.

CASE STUDY 01

US RCM Provider

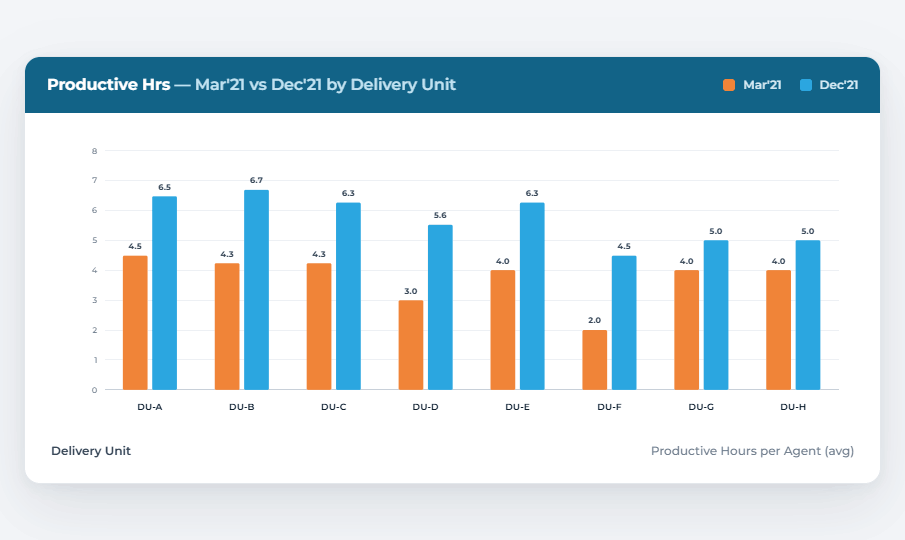
9,000 users · Coding, AR, Billing

500 + FTE

capacity realized without new hires

  • Productivity improved by 29 min/day
  • Scaled deployment from 5,000 + 9,000 users
  • SLA performance lifted across functions
Productive hrs — Mar'21 baseline vs Dec'21 post-deployment
Read more →
CASE STUDY 02

Episource

2,800+ members · Risk Adjustment

2,800 +

members aligned on consistent daily output

  • Reduced idle time and work imbalance
  • Productivity consistency across teams
  • Faster daily output stabilization
Quadrant analysis — medical coding · each dot = one agent
Read more →
CASE STUDY 03

GeBBS Healthcare

Coding, AR, Patient Access

1 hr/day

extra productive time gained per user

  • 15% utilization uplift
  • Lower downtime & manual delays
  • Operational consistency at scale
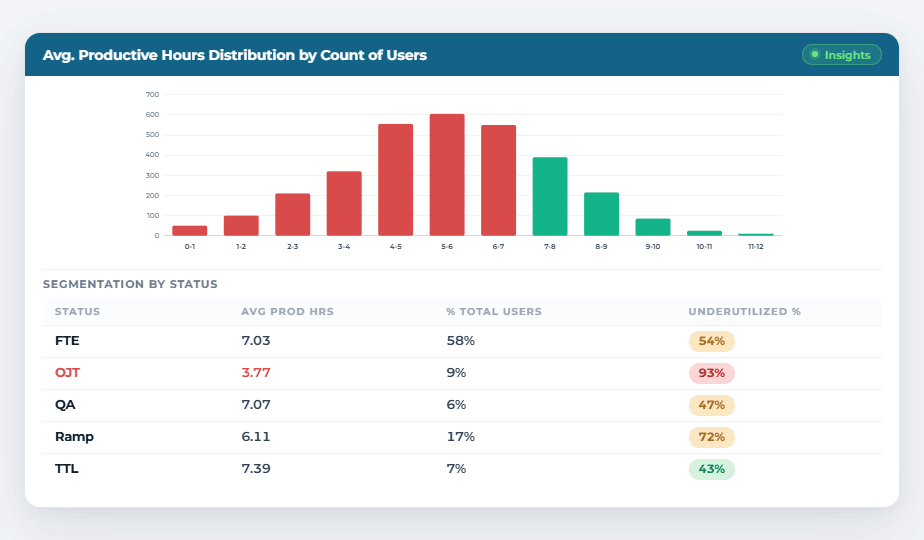
Productive hours distribution — underworked zone (red) identified
Read more →

RCM Success Stories

Our teams became
consistent and
predictable in output.

VP Operations, Episource

Episource

500 +

FTE capacity realized in Year 1 at a leading US RCM company

29 min

daily improvement + 670+ FTE cost avoidance

85%

reduction in downtime claims via Business Forms

96%

renewal rate year over year across 200+ clients

Built for Healthcare Compliance

GDPR AICPA ISO HIPAA

Evaluate How Much Productivity You Can Gain

Receive a 30-minute review of your daily productivity patterns and potential capacity gains

Contact Us