AI Adoption Index Asset Optimization Cost of Delivery Optimization Distributed Process Management AI-enabled Employee Retention Index Hybrid Work Enablement Outsourcing Performance Management
Banking, Financial Services, and Insurance (BFSI) Business Process Outsourcing (BPO) Global Capability Center (GCC) Healthcare Revenue Cycle Management Information Technology (IT/ITeS)
Work Time Work Output Workflow Management Advanced Analytics Asset Optimization ProHanceCX
ProHance for outsourced & contingent teams

You Know What You Bought.
Not What You Got.

The industry’s first governance layer for improving outsourcing performance. Built on the actual work behind your spend, with one evidence base for Finance, Delivery and Vendor Management.

Billable Portfolio Cost dashboard
The problem

Everyone Has Data. No One Sees the Work.

Your VMS, SLA system and vendor scorecards each show part of the picture. None of them measures the work itself.

Finance has
The invoice
What was billed
Delivery has
The SLA
What was promised
Vendor Management has
The scorecard
What was reported
Value at Stake
$10M–$30M+

On a representative $50M–$100M outsourced footprint, a 10–30% effort or leakage variance can represent $10M–$30M+ of annual value at stake.

Illustrative model based on outsourced contract value and potential variance; not a customer-specific result.

The missing layer

The Layer Between What You Paid and What You Got.

ProHance doesn't replace your VMS, SLA systems or vendor reports. It adds the one thing they don't measure: the work itself.

Cost Leakage

Billed hours against productive hours, in dollars.

SLA Compliance

Delivery against target, measured independently, not self-reported.

Output

What each vendor delivers, not just how long they worked.

See it in action

The Same Evidence, Three Different Questions.

Finance, Delivery and Vendor Management each get their own lens on one measured dataset, so the numbers agree before the meeting starts.

Is the Money Working as Hard as It Should?

Beyond billed cost: the financial impact of utilization and effort.

Billable Portfolio CostCost at RiskCost of Idle CapacityLeakage
Decide: where is spend at risk, and where can it be recovered?
Billable Portfolio Cost dashboard
Why ProHance

Built for How Global Delivery Actually Works.

Work Beyond the Keyboard Counts

Calls, document handling and meetings are part of delivery. ProHance measures work on and away from the system, so off-screen work is never counted as idle.

Measured
On & off-system

Your Real Schedules, Not a Fixed Workday

Expected hours come from the shifts and schedules your teams actually run, 24/7 included.

Configured
24/7 shift-aware

Fair Comparison, Whatever the Vendor's Size

The Vendor Health Score ranks performance, not size: every vendor on the same scale.

Ranked
Normalized scoring

Deployed on Your Side

Nothing for vendors to install. Runs inside your own environment, so data residency stays under your control.

Independent
Your environment
Results

What Customers Uncovered

Independent measurement, translated into business value.

3x ROI
in 3 months
Large global bank
$39M
Effort gap uncovered
629
Latent FTEs, 3,000-person team
2.2 hrs
Avg. gap per person, per day
Large insurance firm
$34M
Gap, billed vs. actual effort
347
Excess FTEs uncovered
1.5 hrs
Avg. gap per person, per day

Trusted & Recognized by Industry Leaders

4.6 onG2
SourceForge Leader — Spring 2026G2 LeaderG2 High PerformerG2 Momentum LeaderSlashdot Leader — Spring 2026
SSON Impact Awards
FAQ

Questions Buyers Ask

What is outsourcing performance management?+

It's the practice of governing outsourced and contingent delivery on evidence: measuring the work vendors actually deliver and connecting it to cost, capacity and SLA performance. Most programs manage contracts and invoices well but have no independent measure of the work in between.

How is ProHance different from a vendor management system (VMS)?+

A VMS manages requisitions, contracts, rates and invoices: what was agreed and what was billed. ProHance measures the work behind those invoices and runs alongside your VMS, so the two answer different questions.

What data do we need to get started?+

None. Utilization and idle capacity are available as soon as ProHance is running. Adding your rate cards turns effort gaps into dollar figures, and adding SLA and output data completes the Vendor Health Score.

Which outsourcing models does it support?+

BPO, IT services, shared services and global capability centers, across onshore, offshore and multi-vendor programs.

How quickly can we see results?+

Most organizations start with a single vendor. Existing ProHance customers can see the Delivery view immediately, and a first effort-gap figure typically follows within the first weeks.

Ready when you are

See What the Work Actually Shows.

One performance picture Finance, Delivery and Vendor Management can all decide from.

ProHance for outsourced & contingent teams

You Know What You Bought. Not What You Got.

The industry’s first governance layer for improving outsourcing performance. Built on the actual work behind your spend, with one evidence base for Finance, Delivery and Vendor Management.

Billable Portfolio Cost dashboard
Get a Demo
The problem

Everyone Has Data. No One Sees the Work.

Your VMS, SLA system and vendor scorecards each show part of the picture. None of them measures the work itself.

Finance has
The invoice
What was billed
Delivery has
The SLA
What was promised
Vendor Management has
The scorecard
What was reported
Value at Stake
$10M–$30M+

On a representative $50M–$100M outsourced footprint, a 10–30% effort or leakage variance can represent $10M–$30M+ of annual value at stake.

Illustrative model based on outsourced contract value and potential variance; not a customer-specific result.

The missing layer

The Layer Between What You Paid and What You Got.

ProHance doesn't replace your VMS, SLA systems or vendor reports. It adds the one thing they don't measure: the work itself.

Cost Leakage

Billed hours against productive hours, in dollars.

SLA Compliance

Delivery against target, measured independently, not self-reported.

Output

What each vendor delivers, not just how long they worked.

See it in action

The Same Evidence, Three Different Questions.

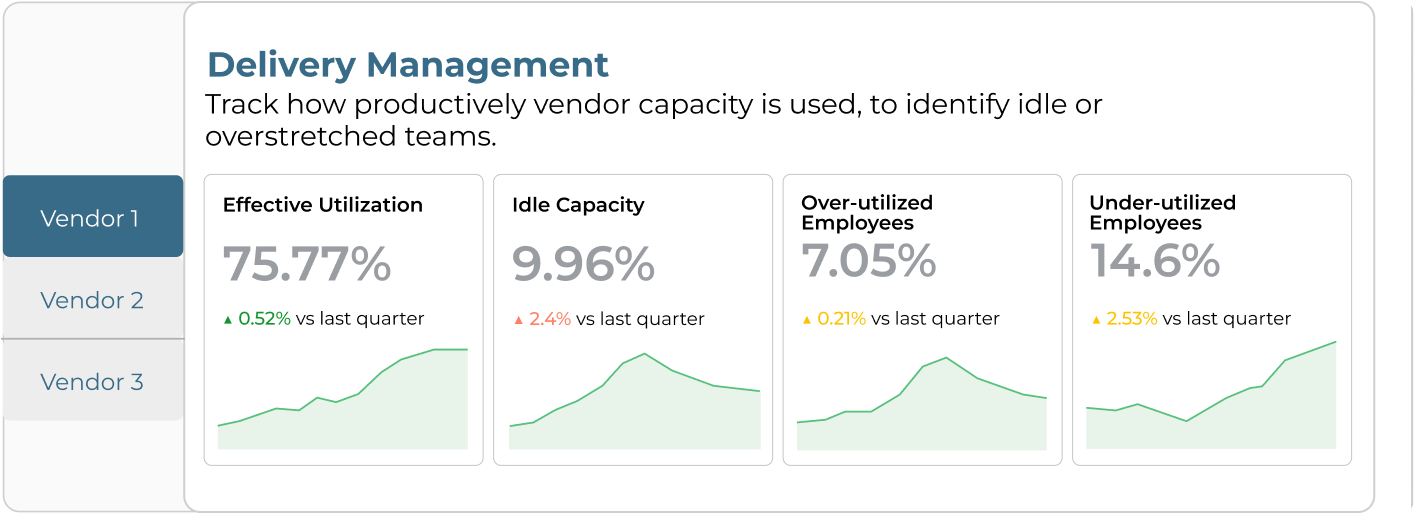
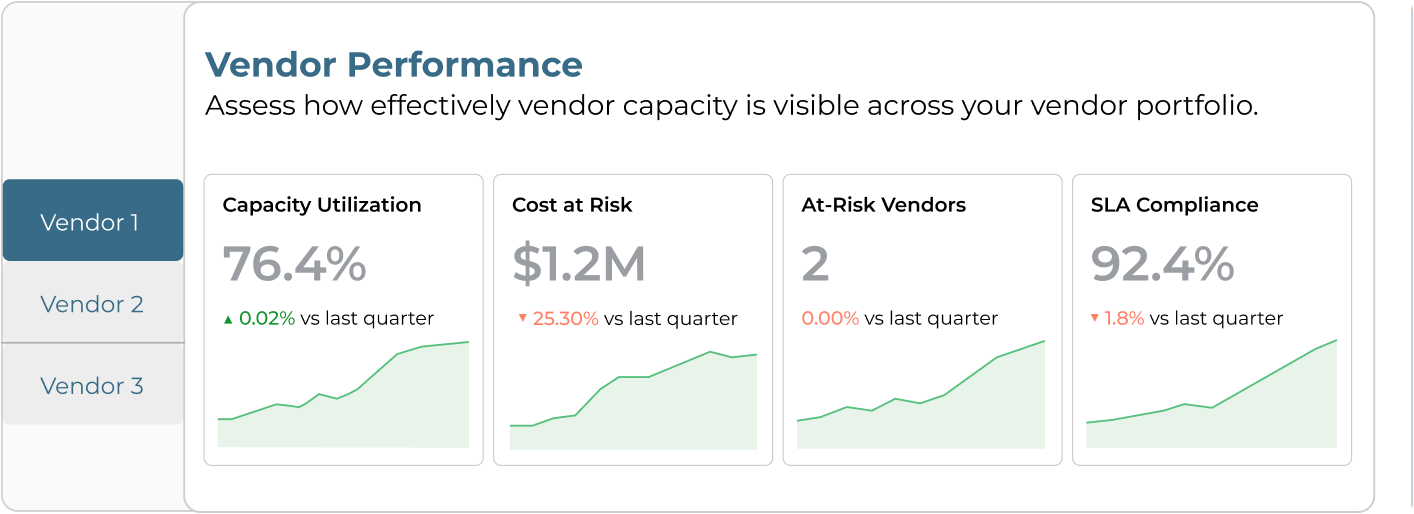
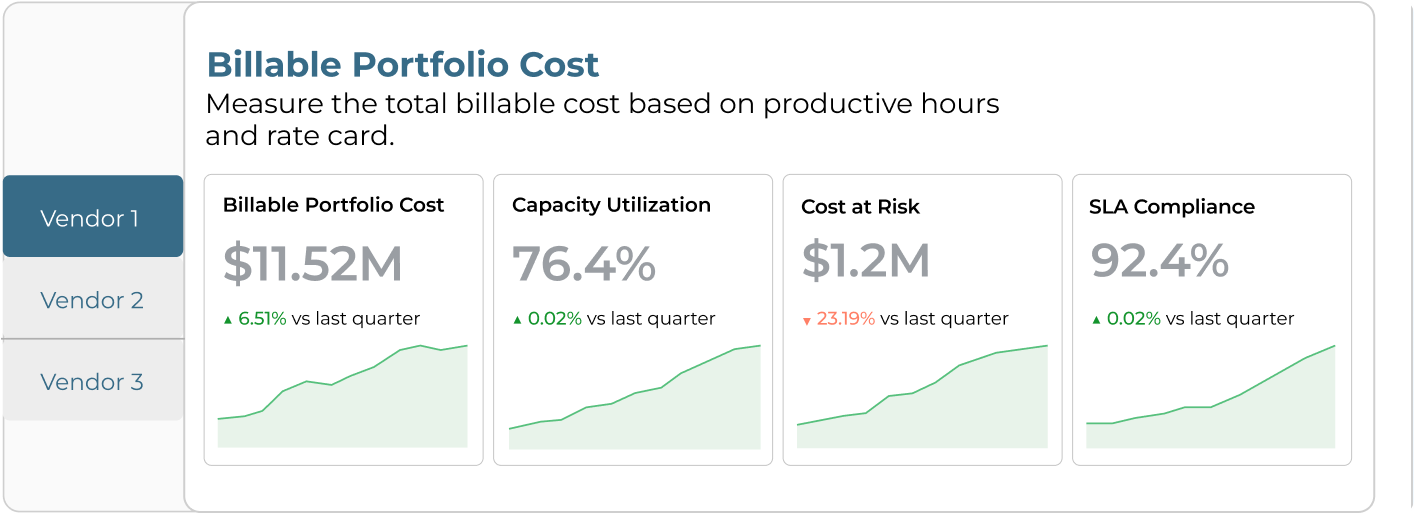
Finance, Delivery and Vendor Management each get their own lens on one measured dataset, so the numbers agree before the meeting starts.

Billable Portfolio Cost dashboard
Is the Money Working as Hard as It Should?

Beyond billed cost: the financial impact of utilization and effort.

Billable Portfolio CostCost at RiskCost of Idle CapacityLeakage
Decide: where is spend at risk, and where can it be recovered?
Why ProHance

Built for How Global Delivery Actually Works.

Measured
On & off-system

Work Beyond the Keyboard Counts

Calls, document handling and meetings are part of delivery. ProHance measures work on and away from the system, so off-screen work is never counted as idle.

Configured
24/7 shift-aware

Your Real Schedules, Not a Fixed Workday

Expected hours come from the shifts and schedules your teams actually run, 24/7 included.

Ranked
Normalized scoring

Fair Comparison, Whatever the Vendor's Size

The Vendor Health Score ranks performance, not size: every vendor on the same scale.

Independent
Your environment

Deployed on Your Side

Nothing for vendors to install. Runs inside your own environment, so data residency stays under your control.

Results

What Customers Uncovered

Independent measurement, translated into business value.

3x ROI
in 3 months
Large global bank
$39M
Effort gap uncovered
629
Latent FTEs, 3,000-person team
2.2 hrs
Avg. gap per person, per day
Large insurance firm
$34M
Gap, billed vs. actual effort
347
Excess FTEs uncovered
1.5 hrs
Avg. gap per person, per day

Trusted & Recognized by Industry Leaders

4.6 onG2
SourceForge Leader — Spring 2026G2 LeaderG2 High PerformerG2 Momentum LeaderSlashdot Leader — Spring 2026
SSON Impact Awards
FAQ

Questions Buyers Ask

What is outsourcing performance management?+

It's the practice of governing outsourced and contingent delivery on evidence: measuring the work vendors actually deliver and connecting it to cost, capacity and SLA performance. Most programs manage contracts and invoices well but have no independent measure of the work in between.

How is ProHance different from a vendor management system (VMS)?+

A VMS manages requisitions, contracts, rates and invoices: what was agreed and what was billed. ProHance measures the work behind those invoices and runs alongside your VMS, so the two answer different questions.

What data do we need to get started?+

None. Utilization and idle capacity are available as soon as ProHance is running. Adding your rate cards turns effort gaps into dollar figures, and adding SLA and output data completes the Vendor Health Score.

Which outsourcing models does it support?+

BPO, IT services, shared services and global capability centers, across onshore, offshore and multi-vendor programs.

How quickly can we see results?+

Most organizations start with a single vendor. Existing ProHance customers can see the Delivery view immediately, and a first effort-gap figure typically follows within the first weeks.

Ready when you are

See What the Work Actually Shows.

One performance picture Finance, Delivery and Vendor Management can all decide from.
Get a Demo
Contact Us